FYI: Market Update for July uses June 2024 Sales Data for Cape Coral, Florida. The data always has a lag time as it analyzes closed sales information to be calculated- so the update is written in the current month analyzing the prior month. Cape Coral is a large city, both in population as well as geographically. The data below is for the entire city followed by dividing it into quadrants using the largest zip code in that section.
Cape Coral- All Zips/Full City
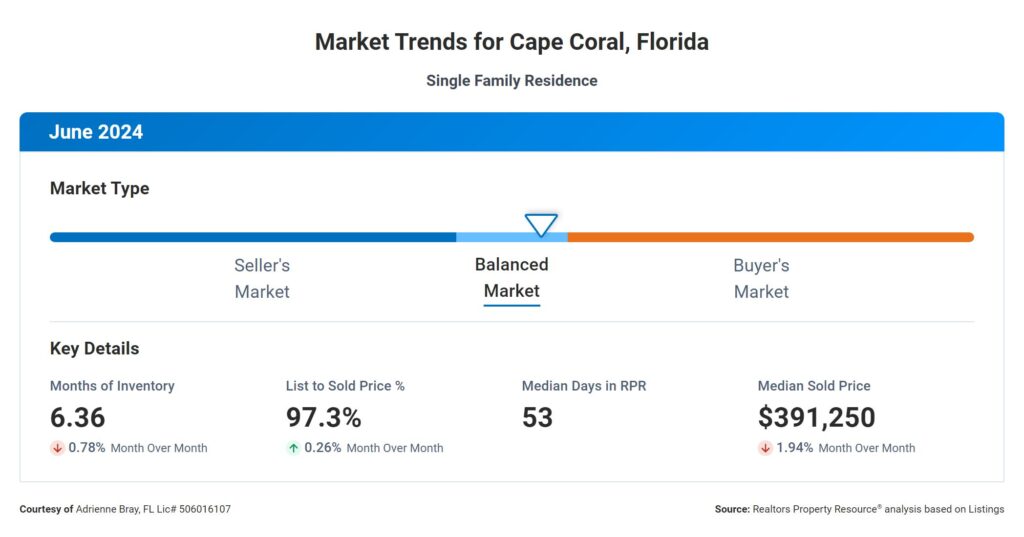
- Months Supply of Inventory: 6.36, indicating a balanced market with a good selection for buyers
- 12-Month Change in Inventory: +71.43%, suggesting a shift towards a buyer-friendly market
- Median Days on Market: 53 days, reflecting strong demand and quick sales
- List to Sold Price Percentage: 97.3%, showing homes are selling close to listing prices
- Median Sold Price: $391,250, highlighting a stable market
- Buyers have more options and potential negotiating power
- Sellers benefit from quick sales and strong returns on investment
Cape Coral- 33993 “NW Cape”
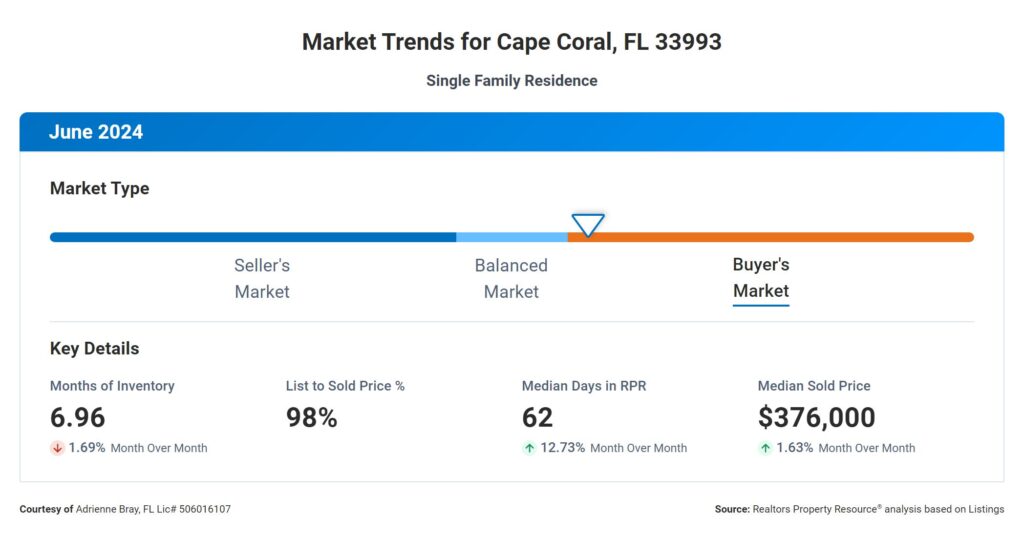
- Months Supply of Inventory: 6.96, indicating a transition towards a balanced or buyer-favored market
- 12-Month Change in Inventory: +56.05%, reflecting rising inventory levels and increased buyer power
- Median Days on Market: 62, showing a moderate pace of home sales
- List to Sold Price Percentage: 98%, indicating homes are selling close to their list price
- Median Sold Price: $376,000, providing insight into the market’s current value range
- Rising inventory gives buyers more options and bargaining power
- Sellers benefit from strong list-to-sold price alignment
- Overall, metrics indicate a dynamic real estate market with opportunities for both buyers and sellers.
Cape Coral- 33909 “NE Cape”
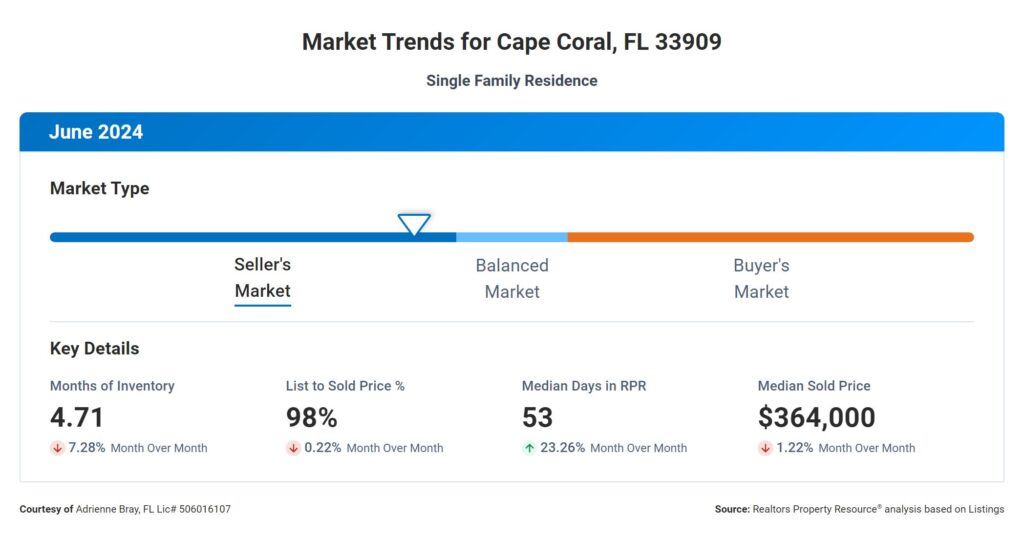
- Months Supply of Inventory: 4.71, indicating a leaning towards a seller’s market
- 12-Month Change in Inventory: +46.73%, showing an increase in available homes, offering more options for buyers
- Median Days on Market: 53, providing an estimate for sellers on how quickly their home might sell
- List to Sold Price Percentage: 98%, suggesting homes are priced accurately and selling close to their list price
- Median Sold Price: $364,000, giving insight into the average home price in the current market
- Overall, the market is balanced with a good supply and steady prices, aiding informed decision-making for buyers and sellers.
Cape Coral- 33914 “SW Cape”
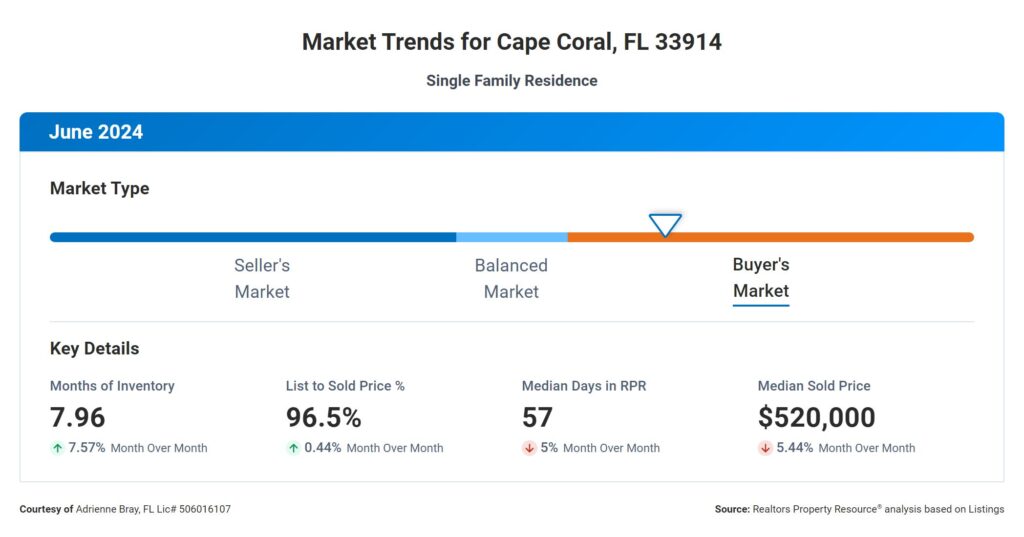
- Months Supply of Inventory: 7.96, indicating it would take just under 8 months to sell all current homes on the market
- 12-Month Change in Inventory: +85.98%, showing a significant increase in the time required to sell all homes compared to a year ago, suggesting a slowing market or more listings
- Median Days on Market: 57, reflecting a fairly quick turnaround for home sales
- List to Sold Price Percentage: 96.5%, suggesting homes are selling close to their list price, indicating accurate pricing
- Median Sold Price: $520,000, providing insight into the current average home price
- Overall, these metrics highlight important trends in the real estate market, aiding buyers and sellers in making informed decisions.
Cape Coral- 33904 “SE Cape”
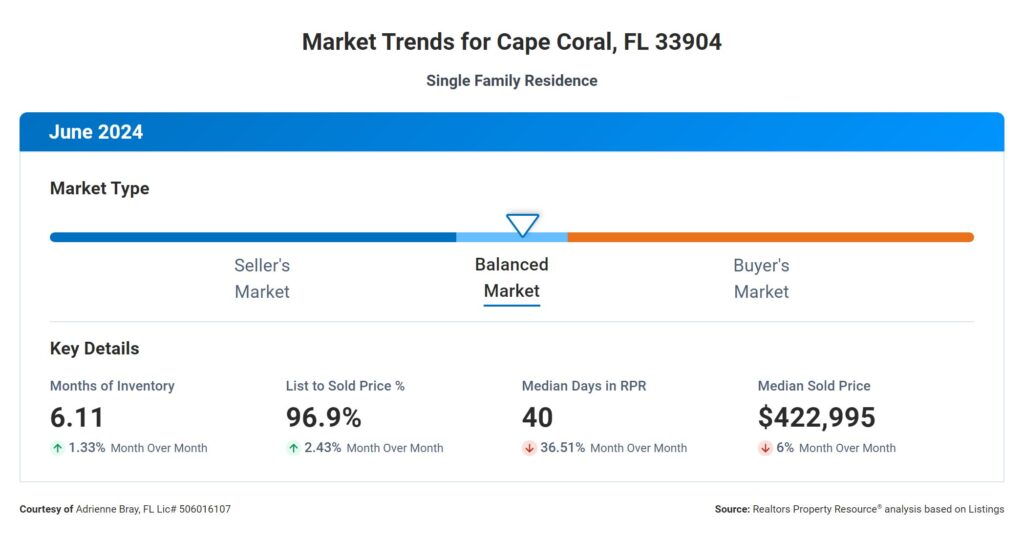
- Months Supply of Inventory: 6.11, suggesting a balanced market between buyers and sellers
- 12-Month Change in Inventory: +76.08%, indicating an increase in homes available, potentially benefiting buyers with more options
- Median Days on Market: 40, showing homes are selling relatively quickly due to high demand or competitive pricing
- List to Sold Price Percentage: 96.9%, suggesting homes are selling close to their list price, reflecting strong negotiation
- Median Sold Price: $422,995, providing a benchmark for average home prices in the area
- Overall, these metrics indicate a balanced market with sufficient inventory, quick sales, and steady prices, aiding buyers and sellers in making informed decisions.
Conclusion
In conclusion, the current real estate market offers a balanced environment for both buyers and sellers, characterized by a moderate inventory supply and homes selling swiftly. The increase in available homes provides buyers with diverse options, while sellers benefit from homes selling close to their list prices, highlighting effective pricing strategies. With a median sold price of $422,995, the market remains stable and predictable. By leveraging these insights, buyers and sellers can confidently navigate the market, making informed decisions that align with their real estate goals. As a real estate professional, staying attuned to these metrics ensures you can provide valuable guidance, fostering successful transactions and satisfied clients.
