FYI: Market Update for August uses July 2024 Sales Data for Cape Coral, Florida. The data always has a lag time as it analyzes closed sales information to be calculated- so the update is written in the current month analyzing the prior month. Cape Coral is a large city, both in population as well as geographically. The data below is for the entire city followed by dividing it into quadrants using the largest zip code in that section.
Cape Coral- All Zips/Full City
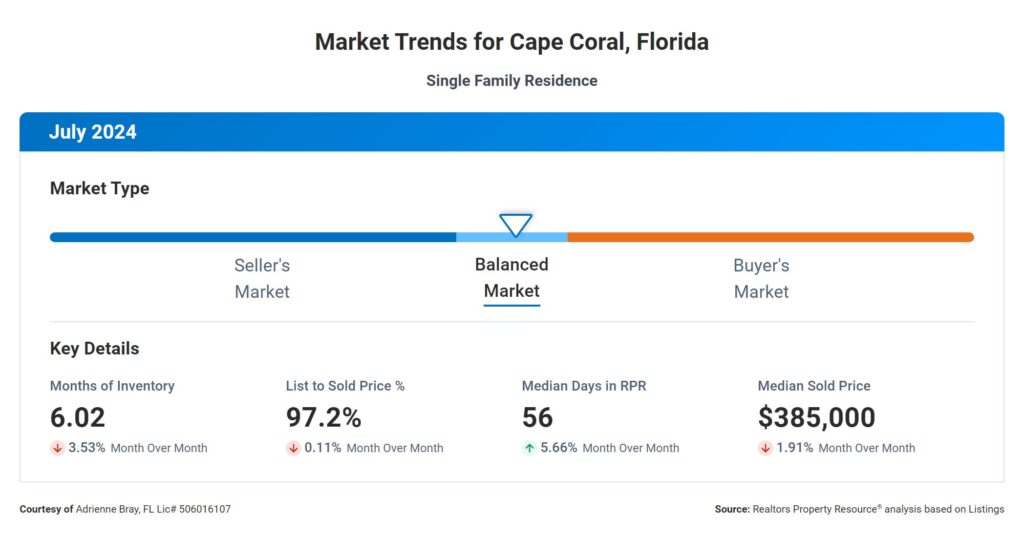
📊 Balanced Market: Months Supply of Inventory is 6.02, indicating a stable market with balanced supply and demand.
📈 Inventory Growth: 12-Month Change in Months of Inventory increased by +62.26%, suggesting a potential shift towards a buyer’s market with more options available.
🏃 Quick Sales: Despite more inventory, Median Days on Market is 56, meaning homes are still selling relatively fast.
💰 Strong Pricing: List to Sold Price Percentage at 97.2% shows homes are selling close to their listing price.
🏡 Market Value: Median Sold Price stands at $385,000, offering buyers and sellers a benchmark for pricing and affordability.
📈 Overall: The market is transitioning, with more inventory but still strong demand and pricing, offering opportunities for both buyers and sellers to make informed decisions.
Cape Coral- 33993 “NW Cape”
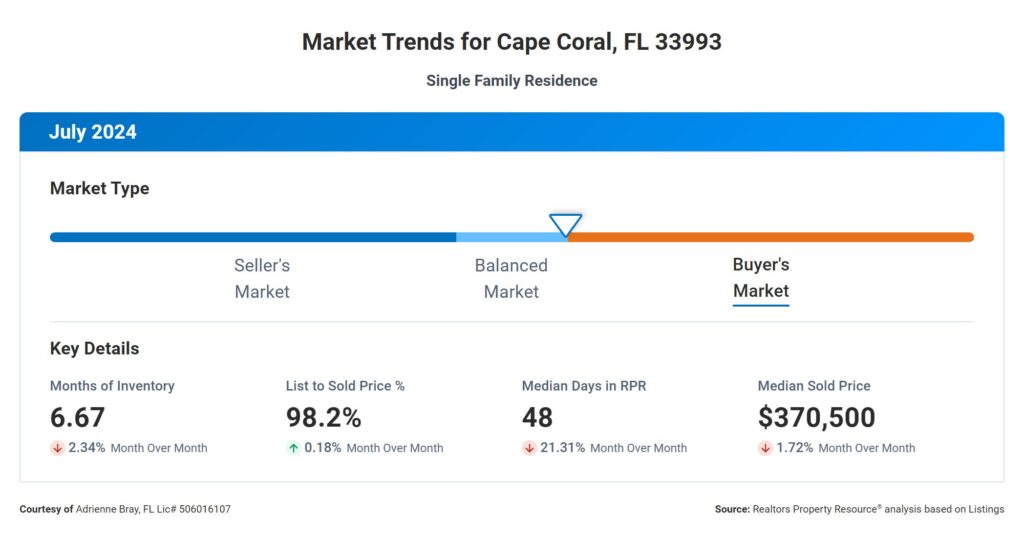
- 📊 Balanced Market: Months Supply of Inventory is 6.67, reflecting a balanced market with no clear advantage for either buyers or sellers.
- 📈 Inventory Increase: A +54.76% increase in months of inventory suggests a possible shift towards a more buyer-friendly market with more homes available.
- 🏃 Strong Demand: Homes are selling in a median of 48 days, showing that demand is still strong and properties are moving relatively quickly.
- 💰 Effective Pricing: Sellers are achieving 98.2% of their list price, indicating that homes are being priced right and negotiations are favorable for sellers.
- 🏡 Reasonable Pricing: The median sold price is $370,500, indicating a reasonable price point in this stable and healthy market.
📈 Overall: The real estate market remains stable, with good opportunities for both buyers and sellers as inventory increases but demand remains strong.
Cape Coral- 33909 “NE Cape”
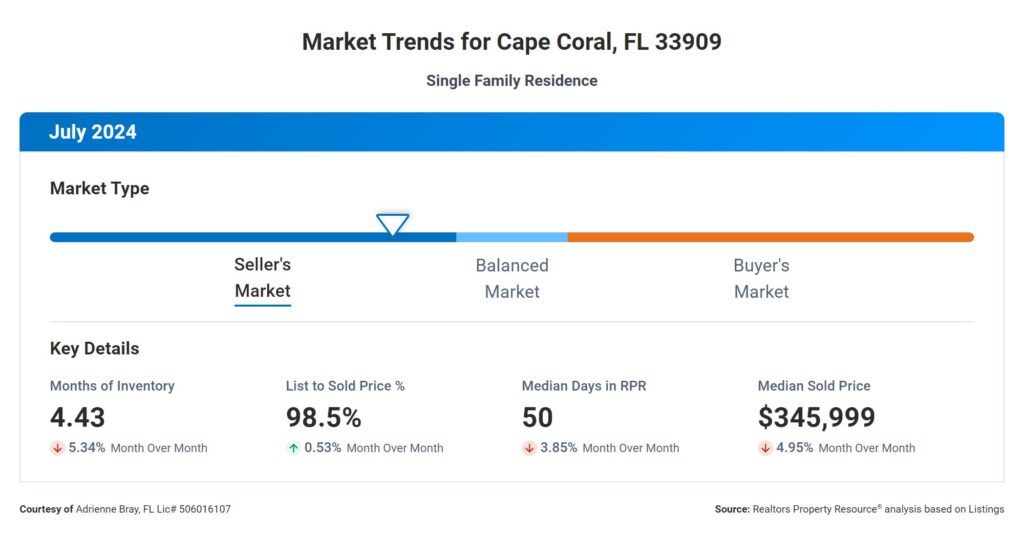
- 📊 Moderate Inventory: With a Months Supply of Inventory at 4.43, the market has a moderate level of homes available for buyers, indicating balanced supply and demand.
- 📈 Inventory Growth: A +45.72% 12-Month Change in inventory suggests that buyers may find more options as the market is gradually increasing in available homes.
- 🏃 Quick Sales: Homes are selling in a median of 50 days, reflecting strong demand and a market that remains active and competitive.
- 💰 Competitive Pricing: Sellers are achieving 98.5% of their list price, indicating that homes are priced right and buyers are willing to pay close to the asking price.
- 🏡 Market Value Insight: The median sold price of $345,999 provides a clear picture of current home values, helping both buyers and sellers make informed decisions.
📈 Overall: The market remains balanced with moderate inventory growth, competitive pricing, and quick sales, making it favorable for both buyers and sellers to navigate.
Cape Coral- 33914 “SW Cape”
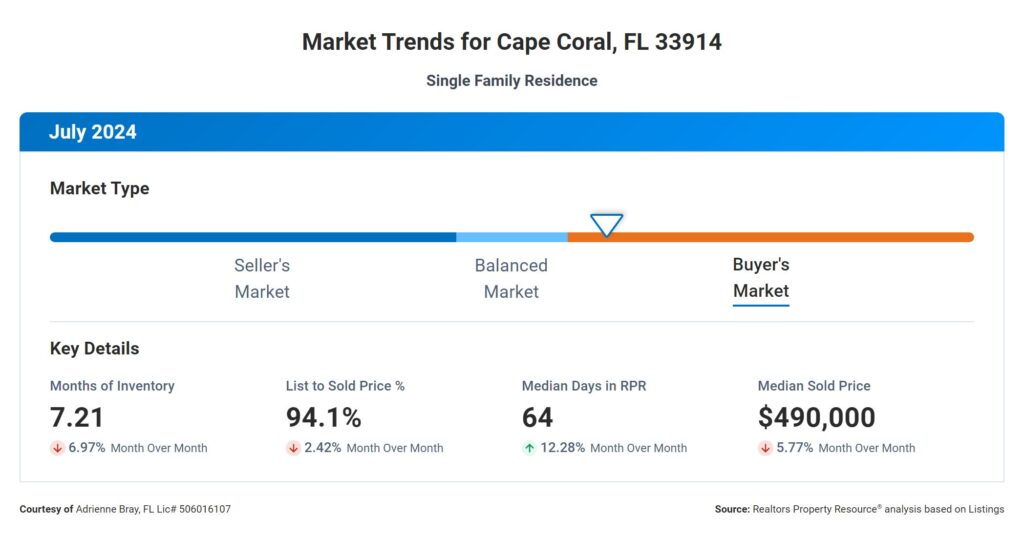
- 📉 Buyer’s Market: With a Months Supply of Inventory at 7.21, the market is leaning towards a buyer’s market, offering more options for home buyers.
- 📈 Rising Inventory: A +58.11% increase in the 12-Month Change in inventory signals more homes available, giving buyers more choices and negotiating power.
- ⏳ Quick Turnaround: Median Days on Market is 64, indicating homes are still selling at a relatively brisk pace despite the increased inventory.
- 💵 Strong Offers: Sellers are getting 94.1% of their listing price, showing that properties are priced effectively, and buyers are still willing to pay close to the asking price.
- 🏡 High Median Sold Price: The median sold price stands at $490,000, giving a clear indication of the market’s current pricing trends.
🔄 Overall: The market is shifting towards buyers, with more inventory, stable pricing, and properties moving quickly, making it an opportune time for buyers to explore the market.
Cape Coral- 33904 “SE Cape”
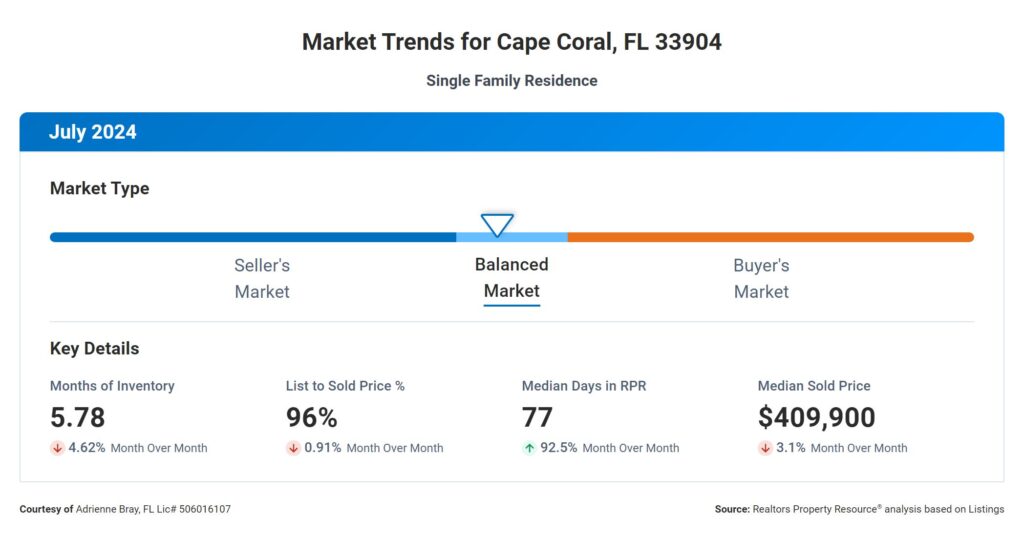
- 🏠 Moderate Inventory: The Months Supply of Inventory is 5.78, indicating a market that’s relatively balanced between buyers and sellers.
- 📈 Rising Supply: The 12-Month Change in Inventory has increased by +56.22%, suggesting a trend towards more homes available, providing buyers with additional choices.
- ⏳ Quick Sales: Median Days on Market is 77, showing that homes are moving at a steady pace despite the rising inventory.
- 💰 Strong Prices: With a List to Sold Price Percentage of 96%, sellers are pricing homes well, and buyers are responding with offers close to the asking price.
- 💵 Median Sold Price: At $409,900, this metric gives both buyers and sellers a clear view of current market values, guiding pricing and offer strategies.
🔄 Overall: The market offers good opportunities for both sides, with increasing inventory, competitive pricing, and steady sales. Staying informed on these metrics will help buyers and sellers navigate the market confidently.
Conclusion
In conclusion, analyzing the real estate metrics across these four zip codes and the entire city reveals a market in transition, with increasing inventory and consistent home values. While properties are selling relatively quickly and close to their list price, the rise in inventory presents new opportunities for buyers. If you’re considering buying or selling in this evolving market, staying informed and working with a knowledgeable agent is key. Whether you’re looking to capitalize on a balanced market or find the perfect home in these areas, reach out today to discuss your goals and how we can navigate the market together! 📞💼
